

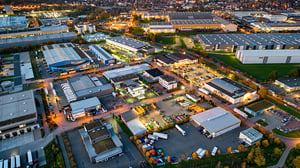


Why two plants in the same market can face completely different realities in hiring, turnover, and talent availability.
A city may have thousands of industrial workers, universities graduating hundreds of professionals every year and a strong manufacturing infrastructure. However, those indicators do not guarantee that a new plant will be able to hire the people it needs, retain them and operate efficiently.
International investors evaluating where to establish or expand operations in Mexico need to know more than how many workers are available in a city. They also need to understand how many of those workers can realistically reach a specific facility, at the required time, and at a competitive labor cost.
This difference can completely change the evaluation of an industrial site. Two plants located within the same metropolitan area may compete for different groups of workers, experience very different turnover rates and require hiring and transportation budgets that vary significantly.
That is why, in addition to analyzing wages, population and economic activity, companies need to understand the labor shed of each location. This approach helps evaluate the actual availability of talent and anticipate costs that may not appear in the early stages of site selection.
City-Level Labor Indicators Don’t Tell the Whole Story
When evaluating a new location, metropolitan-level data provides a useful starting point. The economically active population, number of industrial workers, unemployment rates and educational pipeline can all help companies understand the size of the labor market.
The problem arises when these indicators are interpreted as if the entire workforce were equally accessible to every company within the same city.
In practice, workforce accessibility depends on factors such as the distance between residential areas and industrial parks, traffic conditions, public transportation options, and shift schedules. It is also influenced by the concentration of companies competing for similar profiles and by where workers actually live. A region may show a large supply of workers in its overall statistics while still facing shortages of operators, technicians, or engineers within a specific industrial corridor.
For a company planning to hire hundreds of employees, this difference can be critical. The talent identified in a regional study does not necessarily represent a pool of candidates that is realistically accessible to a particular plant.
What Is a Labor Shed and Why Should It Matter to You?
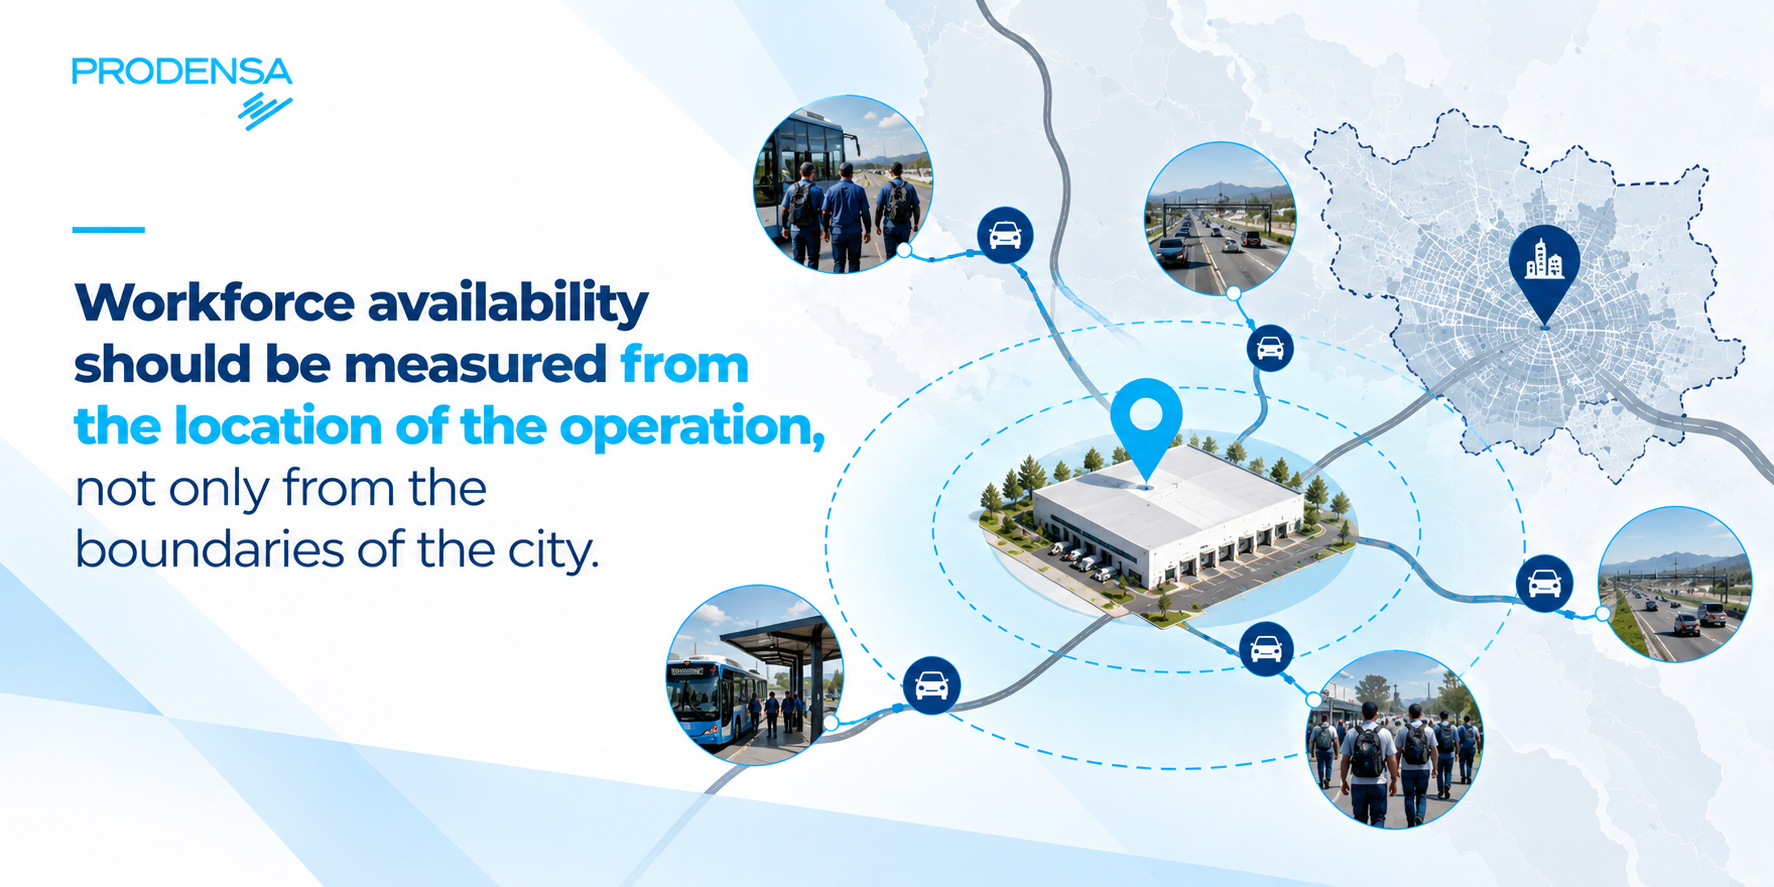
A labor shed defines the actual geographic area from which an industrial facility draws its workforce. It does not necessarily align with municipal boundaries or ZIP codes. Instead, it reflects real commuting patterns, infrastructure networks, travel times, shift schedules, and localized competition for talent.
Understanding a labor shed requires shifting from administrative boundaries to a time-and-distance perspective. For example, a 15-kilometer trip along an open suburban highway may take only 12 minutes. That same 15-kilometer distance through an urban area with congested bridges could easily turn into a 50-minute commute.
A functional labor shed maps where people live in relation to where they work, helping define the true geographic boundary of candidate availability.
The following table compares these two approaches to labor market analysis:
|
Geographic Dimension |
Administrative Metropolitan Model |
Functional Labor Shed Model |
Operational Impact |
|
Primary boundary |
Municipal boundaries, counties, MSA perimeter |
Isochrones (equal travel-time areas) |
Defines realistic candidate attraction zones |
|
Data basis |
Census data by place of work |
Population density by place of residence |
Avoids overcounting workers who commute outside the area |
|
Infrastructure assessment |
Static road-mile measurements |
Traffic flows by time of day and transportation nodes |
Captures peak-hour delays during shift changes |
|
Competitive assessment |
Regional averages of industrial presence |
Competitive density of microclusters within the isochrone |
Identifies localized wage competition and employee poaching risk |
|
Labor Cost Modeling |
Median Regional Benchmark Wages |
Total Cost of Labor (TCL), Including Friction Costs |
Captures Hidden Costs from Turnover, Overtime, and Subsidies |
SOURCE: Prodensa Analysis
Two Plants, One City, Two Different Labor Markets
Imagine two manufacturing facilities located just 15 or 20 kilometers apart within the same metropolitan area.
-
The first is located on the urban outskirts, near growing residential communities and with direct access to a major roadway. Within its 30-minute labor shed, there is a solid base of industrial workers and relatively few companies competing for the same profiles.
-
The second operates in an established industrial park closer to the urban core. Although regional statistics show a high concentration of workers, more than 20 manufacturing and logistics facilities within its immediate area compete for operators, assembly technicians and material-handling personnel. In addition, a congested transportation corridor makes commuting more difficult during shift changes.
Both plants are part of the same metropolitan labor market, but their hiring conditions can be very different.
|
Factor |
Plant A: Growth Corridor |
Plant B: Saturated Industrial |
|
Residential access |
Close to expanding residential areas |
Greater friction between housing and employment |
|
Commute conditions |
Relatively smooth road access |
Peak-hour congestion |
|
Labor competition |
Lower concentration of similar employers |
More than 20 facilities competing for similar profiles |
|
Hiring and retention |
Greater potential to maintain a stable workforce |
More pressure to fill vacancies and retain employees |
|
Wage costs |
Lower potential competitive pressure |
Possible wage premiums and hiring bonuses |
Source: Prodensa Analysis
This scenario shows why choosing a location within a well-established industrial cluster does not necessarily guarantee better labor outcomes. A high concentration of companies can offer advantages in infrastructure and supplier access, but it can also intensify competition for workers.
Commute Time Determines the Real Size of the Workforce
Physical distance does not always reflect how accessible a plant really is. When evaluating the labor market, companies need to understand how long it actually takes workers to reach the facility at the times they are expected to report for work.
Bridges, railroad crossings, toll booths, highway entrances and congested avenues can divide the same city into different labor markets. Traffic conditions also change throughout the day, meaning a route that works well during regular hours may become a major obstacle during shift changes.
The analysis should also account for differences between job profiles. Production workers may have less flexibility to absorb additional fuel costs or long commute times, while some specialized professionals may be willing to travel farther depending on compensation and available career opportunities.
As an illustrative reference, here are some typical commute ranges:
|
Profile |
Salary Range |
Commute Time |
|
Operators and assembly workers |
US $15–US $20 per hour |
20–25 minutes |
|
Specialized technicians and machinists |
US $24–US $35 per hour |
30–45 minutes |
|
Engineers and plant managers |
More than US $45 per hour or equivalent salary |
45–60 minutes or more |
Source: Prodensa Analysis
These ranges should not be interpreted as universal standards or as salary benchmarks specific to Mexico. They are illustrative examples showing how commute tolerance can vary by job profile and compensation level. Each project requires current, market-specific data that has been properly validated.
For an investment decision, the objective is to determine how many potential candidates live within a reasonable commute time and how many of them have the skills required for the operation.
Employee Transportation Should Also Be Part of the Strategy
A location may offer advantages in land cost, infrastructure or logistics connectivity and still face challenges in attracting workers from the areas where they live.
 In those cases, company-sponsored transportation can expand the effective labor shed. Employee buses, private transportation routes, pickup points and mobility support can connect the facility with communities that would otherwise be difficult to reach.
However, implementing this type of system requires careful planning. Routes should reflect where employees live, schedules must align with shift times and arrival windows need to account for real traffic conditions. Even a small timing difference can affect punctuality and workforce availability at the start of each shift.
Transportation costs should also be included in the financial evaluation of a site. A lower-cost property may lose part of its advantage if the company needs to fund additional routes to meet its hiring needs.
The question, therefore, is not only whether a location has access to talent but how much it costs to connect that talent with the operation?

Who Else Is Hiring from the Same Labor Pool?
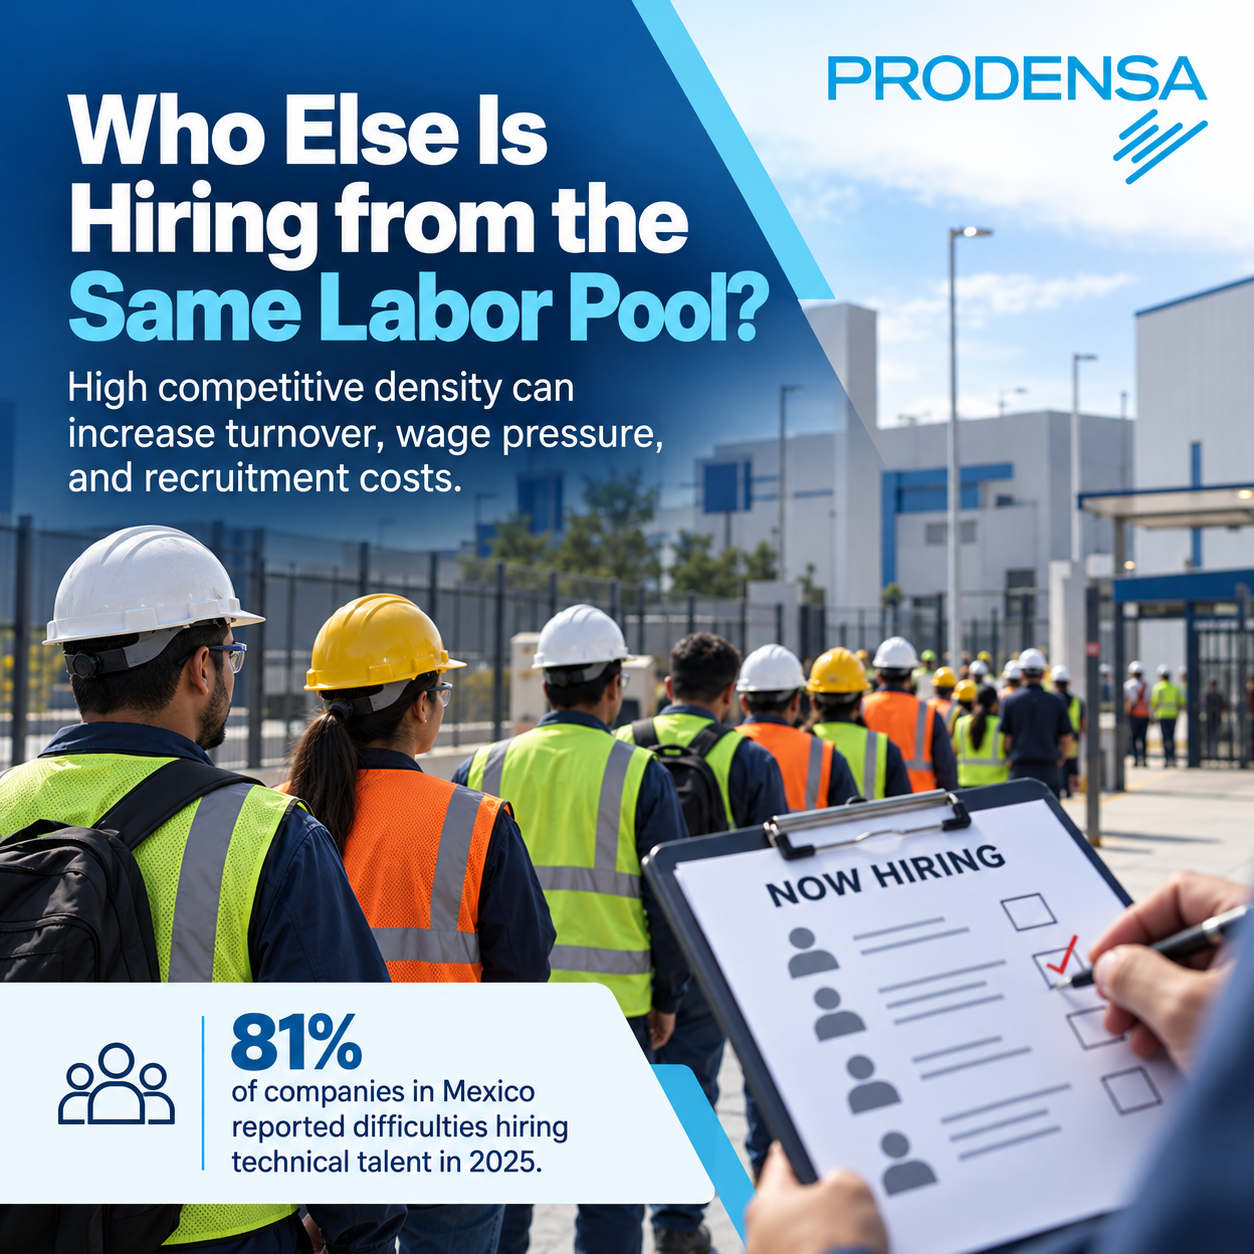
Analyzing a labor shed requires looking not only at the supply of talent, but also at the localized demand for workers. Competitive density measures how many employers within the same commute-time area are recruiting for similar occupational profiles.
When multiple manufacturing, warehousing or processing facilities operate within the same 20-minute isochrone and compete for similar skill sets, the local labor market can face a structural shortage. In saturated labor sheds, workers may frequently change jobs for relatively small pay increases (such as $0.50 or $1.00 USD per hour) without changing their daily commute.
Evaluating competitive density requires reviewing existing operations, shift patterns, benefit packages, and announced future projects. The arrival of a large industrial operation can quickly put additional pressure on a localized labor shed, increasing recruitment costs and turnover at nearby operations.
Industrial Concentration Can Be an Advantage... or a Warning Sign
Economic theory has long recognized that industrial concentration can create important operational advantages. Locating near other companies in the same industry can support specialized supplier networks, workforce training programs and a deeper pool of experienced technical talent.
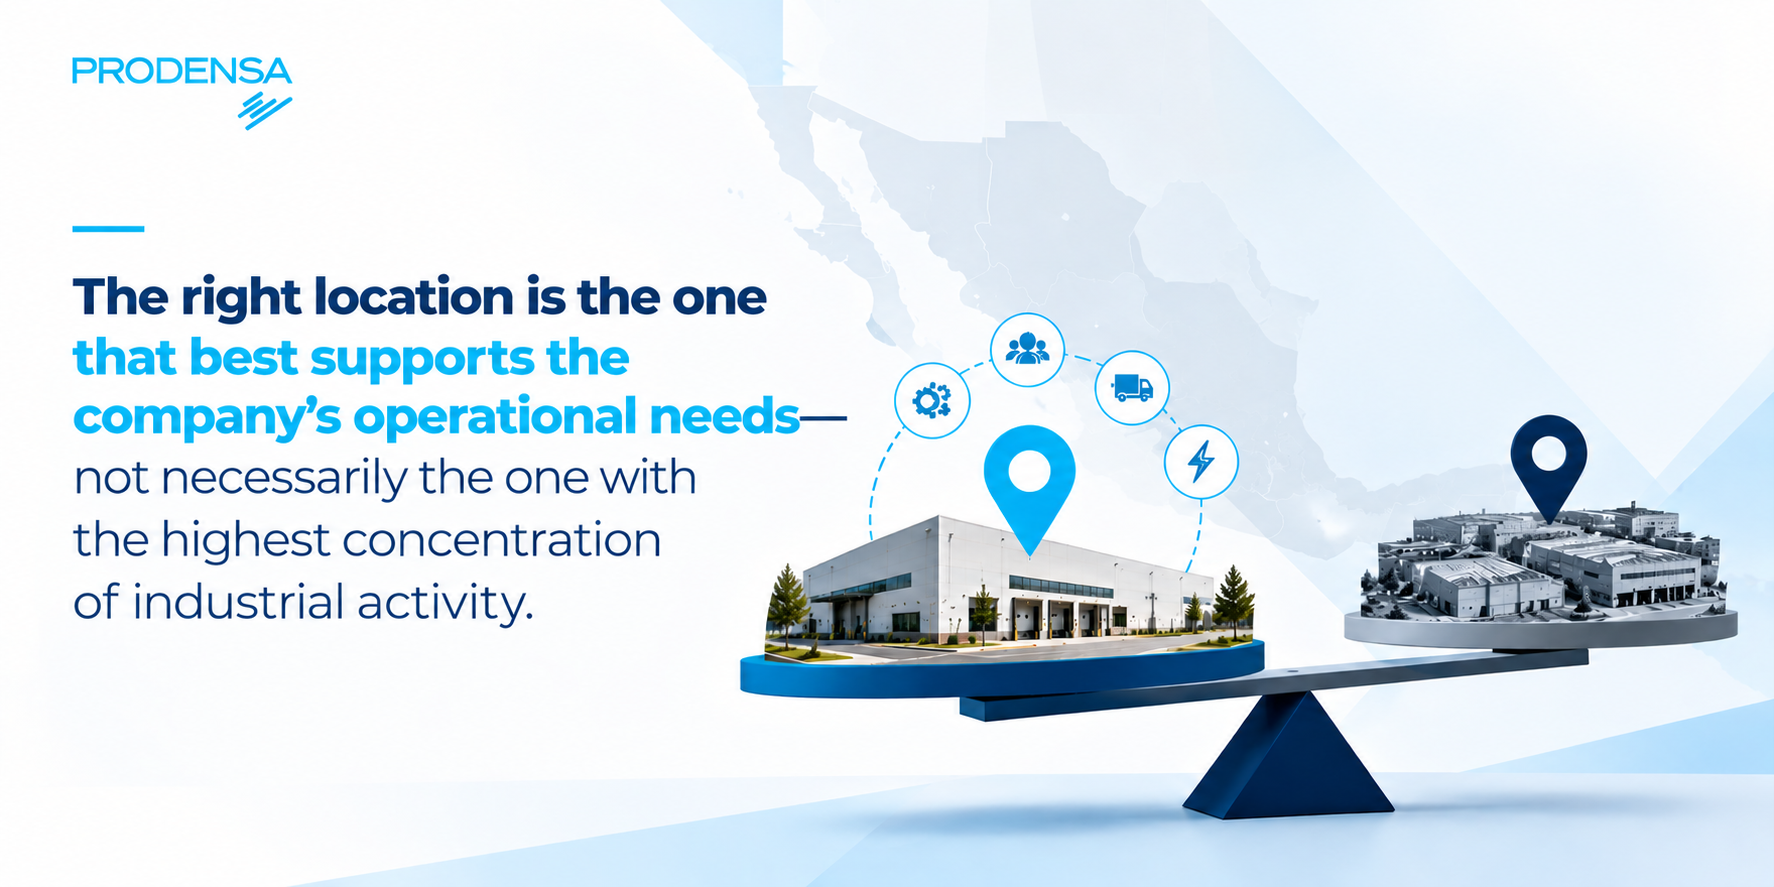
However, industrial concentration can become a disadvantage when a market becomes oversaturated. When demand for talent significantly exceeds local labor supply, clustering benefits can give way to greater labor pressure. New entrants may need to offer higher wages or hiring bonuses to attract workers, while established plants respond with compensation increases and retention incentives, creating localized wage escalation without expanding the available labor pool.
This increased competition for talent can also affect day-to-day operations. Oversaturated labor markets may experience challenges like:
-
higher voluntary turnover
-
chronic shift absenteeism
-
quality issues
-
greater pressure on frontline supervisors, making workforce stability more difficult to maintain.
Field Validation: Data Must Be Verified on the Ground
While desktop analysis can help narrow down potential locations, field validation is essential before committing capital. Desktop models can miss real-world operational factors such as localized traffic delays, congestion during shift changes, and changing labor market conditions.
Field validation should combine real-world commute checks with local stakeholder input. Analysts can drive key routes during shift changes (such as 6:00 AM, 2:00 PM and 10:00 PM) to assess traffic, bottlenecks, bus stops, lighting, pedestrian access and worker safety, while discussions with HR leaders, plant managers, economic development organizations and staffing agencies can reveal real-time wage adjustments, hiring bonuses, employee poaching and retention challenges that static databases may miss.
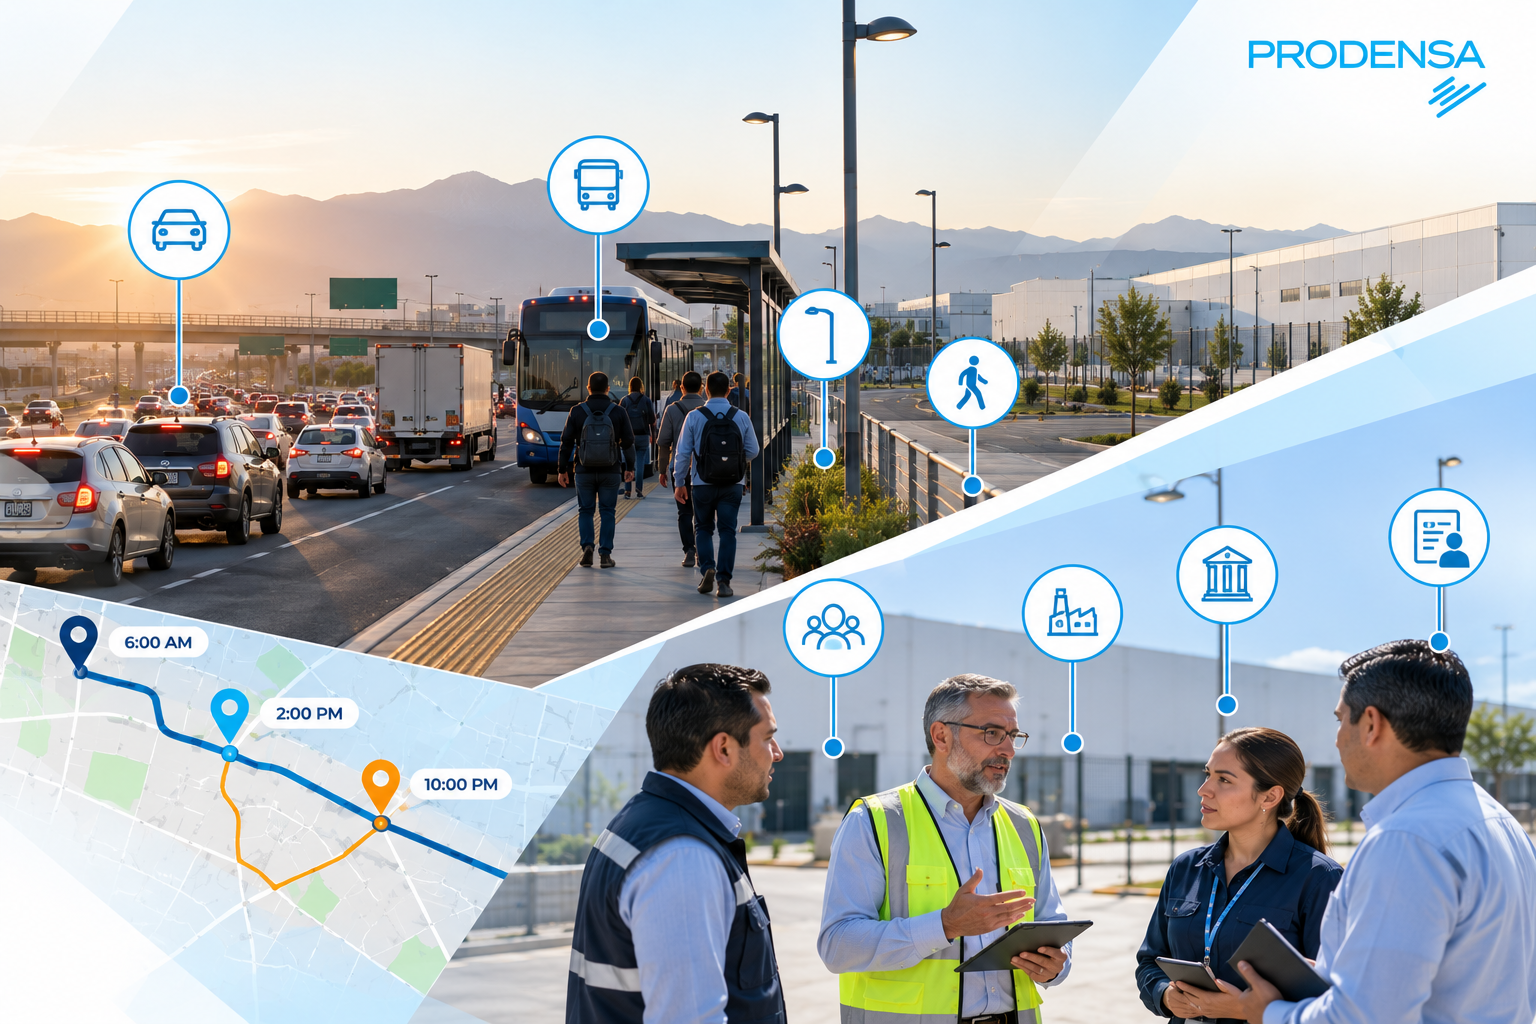
In this process, Prodensa helps companies connect workforce intelligence with site selection by combining market analysis with validation of local conditions. Its Workforce Solutions and site selection services can provide a starting point for evaluating the specific needs of each project.
The Right Location Is the One That Can Support the Operation Long Term
- Choosing where to establish a manufacturing plant requires looking beyond a city’s general indicators. Actual workforce availability depends on the relationship between housing, mobility, occupational profiles, employer competition, and operating costs.
- Two sites within the same market can deliver very different results because their labor sheds are not the same. Understanding those differences helps companies anticipate hiring risks, design transportation strategies, estimate the total cost of labor, and evaluate the operation’s ability to grow.
- For international investors, integrating workforce intelligence into site selection from the early stages can improve decision-making and reduce surprises once hiring begins.


-
Labor Shed: The geographic area from which a facility realistically attracts its workforce, based on commute times, transportation access, shift schedules, and where workers live.
-
Isochrone: A map area that shows all locations reachable within the same amount of travel time, such as 20, 30, or 45 minutes.
-
Competitive Density: The concentration of employers within the same labor shed that are competing for similar occupational profiles and skill sets.
-
Total Cost of Labor (TCL): A broader measure of labor cost that goes beyond wages to include factors such as turnover, overtime, transportation support, hiring incentives, and other workforce-related costs.

What is a labor shed in site selection?
A labor shed is the geographic area from which a facility can realistically attract workers based on commute times, transportation access, shift schedules, and where people live.
Why can two plants in the same city face different hiring conditions?
Because each site may have a different labor shed, level of employer competition, traffic pattern, and access to residential areas.
How does commute time affect workforce availability?
A longer or more difficult commute can reduce the number of candidates willing or able to reach the facility, especially for operational roles.
Can industrial clusters make hiring more difficult?
Yes. While clusters can provide infrastructure and supplier advantages, a high concentration of employers can also increase competition for workers, wage pressure, and turnover.

- Workforce availability should be measured from the site, not just from the city. A strong metropolitan labor market does not guarantee that the right workers can realistically reach a specific facility.
- Commute time can change the real size of the talent pool. Traffic, transportation access, shift schedules, and residential patterns can make two nearby sites perform very differently.
- Industrial concentration is not always an advantage. A strong cluster can provide infrastructure and suppliers, but it can also increase competition for talent, wage pressure, and turnover.
- Transportation is part of the labor cost equation. A lower-cost site may lose its advantage if significant employee transportation support is required.
- Workforce intelligence should be part of site selection from the beginning. Combining labor data, competitive analysis, and field validation helps companies choose locations that can support long-term operations.

Notice: The content of this blog is developed by Prodensa for informational and educational purposes regarding nearshoring, foreign trade, human capital, and manufacturing in Mexico. Although we strive to keep the information accurate and up to date, laws and regulations may change. This material is not a substitute for specialized professional advice. Prodensa is not responsible for decisions made based on this content without appropriate professional consultation.